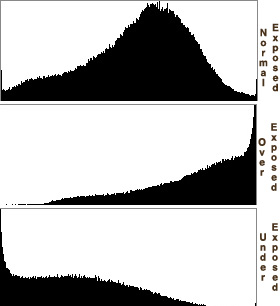
 The histogram displays a graph of the current light and dark tonal values. The horizontal axis represents the 256 colours or shades of grey, and the vertical axis represents the amount of pixels in each of those colours. The histogram of an image that has been edited aggressively will have gaps and spikes. These represent lost of tonal details due to the aggressive editing. This is not necessarily a bad thing, more of a creative latitude.
'
TONES
The region where most of the brightness values are present is called the "tonal range." Tonal range can vary drastically from image to image, so developing an intuition for how numbers map to actual brightness values is often critical—both before and after the photo has been taken. There is no one "ideal histogram" which all images should try to mimic; histograms should merely be representative of the tonal range in the scene and what the photographer wishes to convey.
High and Low Key Images
Images where most of the tones occur in the shadows are called "low key," whereas with "high key" images most of the tones are in the highlights.
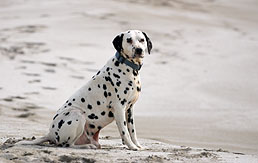 |
| High Key |
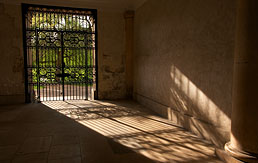 |
| Low Key |
CONTRAST
Contrast is a measure of the difference in brightness between light and dark areas in a scene. Broad histograms reflect a scene with significant contrast, whereas narrow histograms reflect less contrast and may appear flat or dull.

End Notes : http://www.cambridgeincolour.com/tutorials/
No comments:
Post a Comment